Category Archives: Design sheets

Solving Laplace equation in MS Excel for two dimensional solution

Laplace equation is second order derivative of the form shown below.

laplace.pngwhere phi is a potential function.

This equation is used to describe the behavior of electric, gravitational, and fluid potentials. In the study of heat conduction, the Laplace equation is the steady-state heat equation. This equation also describes seepage underneath the dam.

Direct solution of this equation is very tedious( and uninteresting). Numerical technique gives another approach to solve this equation. In numerical method, the solution space is converted in discrete number of points (a two dimensional array). Any point ‘p’ inside the solution matrix is the average of its surrounding points (4 points if 4 direction is considerer, 6 points if diagonal elements are included). The known points will be the potential(Phi value) at the boundary. Iteration has to done until desired accuracy is obtained. (similar to playing Minesweeper)

Excel sheet is nothing but a huge matrix.Thus providing ideal place to play with matrix. To solve Laplace equation, first of all each cell should be given a fixed width, i.e. say each cell will be 0.5m. After that, draw boundary, by putting the known phi value at the boundary. Any cells within the boundary will now given a formula which says =average(all surrounding cells). By doing so you will create cyclic function which will run automatically until desired level of accuracy is met. You must enable iterative calculation and set the desired accuracy in excel in its option menu.

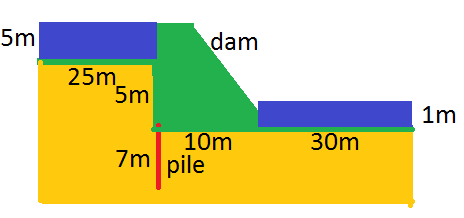
I will demonstrate this with an example of seepage problem underneath the dam(green) as shown in figure. The dam has a pile in the upstream toe. There is seepage treatment 25m u/s and 30m d/s of dam. The base width of dam is 10m. The pile is 7m deep sheet pile (where seepage=0). The u/s water head is 5m and d/s water head is 1m. We are interested in distribution of water head inside the soil ( shown in yellow). As 2 dimensional Laplace equation will describe the flow field in this problem, we will solve it in excel sheet. Let us suppose at 25m below the dam foundation there is impermeable layer (another impermeable boundary).seepage under dam.png
Each cell is considered to be1.0m wide. Red cells denotes the boundary. The pile is also hydraulic boundary. The green is dam (done to show similarity with picture). Now a formula is written in any cell stating it as average of 4 surrounding cells (for e.g I10=AVERAGE(I9,H10,I11,J10)) and copy the cell in yellow zone. The boundary condition at u/s is phi=5m water head and at d/s is phi=1m of water head. After you copy formula to each of yellow cell, excel starts to calculate. For this iterative calculation has to be turned on (check Excel>options>formula). The higher the number of iteration, more accurate the result. Sometimes you may have to hit “Calculate sheet” button multiple times to get the result. A chart will show equipotential lines. A sample is shown in figure below. The excel sheet can be downloaded here.

potential.png

Derivation of combined angle- Version 2

The simple analysis of combined angle (or compound angle) was described in this article.There the derivation was based on two deflection angles only. And hence the solution was approximate. For more accurate analysis, same approach can be used. The additional parameter included is the slope of incoming line.

However, a different approach which uses only coordinates can be used to calculate the actual deflection angle of two lines in 3D space. This approach will not only give the deflection angle but also provide accurate length of those lines.

angle3D.JPG

Let us suppose three coordinates in space and let X be the angle between these two lines
A(x1,y1,z1)
B(x2,y2,z2)
C(x3,y3,z3)

The vector AB is given by

AB=(x2-x1)i+(y2-y1)j+(z2-z1)k
=(a1)i+(a2)j+(a3)k

Similarly BC is given by

BC=(x3-x2)i+(y3-y2)j+(z3-z2)k

=(b1)i+(b2)j+(b3)k

The dot product of vector is given by AB.BC =AB*BC*CosX

Here AB and BC=length of segment AB and BC respectively and is given by
L1=AB=sqrt(a1^2+a2^2+a3^2)

L2=BC=sqrt(b1^2+b2^2+b3^2)

Thus CosX=AB.BC/(L1*L2)

Total Lent of segment L=L1+L2

A worksheet using this approach can be downloaded here. (combinedAngle_vectorMethod) . The sheet also contains VBA codes to visualize the alignment.

3Danimation.gif

Indian Standard Steel Table

The collection of all the steel sections used in structural design of steel structure is given here. Download the excel data file. It contains Excel file containing all the steel sections used in Indian standard (IS). It will be very useful to all the steel designers.

angle.JPG

Angle section

box.JPG

Tube section

channel.JPG

Channel section

i.JPG

I section

pipe.JPG

Pipe section

Breaking Excel passoword

The password protection of MS-Excel are not intended for security of data but for security of input and output of worksheet.

You can crack the password of the protected worksheet by using following VBA procedure.


Sub PasswordBreaker()
'Author unknown
'Breaks worksheet password protection.
Dim i As Integer, j As Integer, k As Integer
Dim l As Integer, m As Integer, n As Integer
Dim i1 As Integer, i2 As Integer, i3 As Integer
Dim i4 As Integer, i5 As Integer, i6 As Integer
On Error Resume Next
For i = 65 To 66: For j = 65 To 66: For k = 65 To 66
For l = 65 To 66: For m = 65 To 66: For i1 = 65 To 66
For i2 = 65 To 66: For i3 = 65 To 66: For i4 = 65 To 66
For i5 = 65 To 66: For i6 = 65 To 66: For n = 32 To 126
ActiveSheet.Unprotect Chr(i) & Chr(j) & Chr(k) & _
Chr(l) & Chr(m) & Chr(i1) & Chr(i2) & Chr(i3) & _
Chr(i4) & Chr(i5) & Chr(i6) & Chr(n)
If ActiveSheet.ProtectContents = False Then
MsgBox "One usable password is " & Chr(i) & Chr(j) & _
Chr(k) & Chr(l) & Chr(m) & Chr(i1) & Chr(i2) & _
Chr(i3) & Chr(i4) & Chr(i5) & Chr(i6) & Chr(n)
Exit Sub
End If
Next: Next: Next: Next: Next: Next
End Sub

This piece of code was found here